Designing for attention, not for clicks
Good interfaces respect the reader's time. A few principles I try to follow.
Published
9 June 2026 · 5 min read
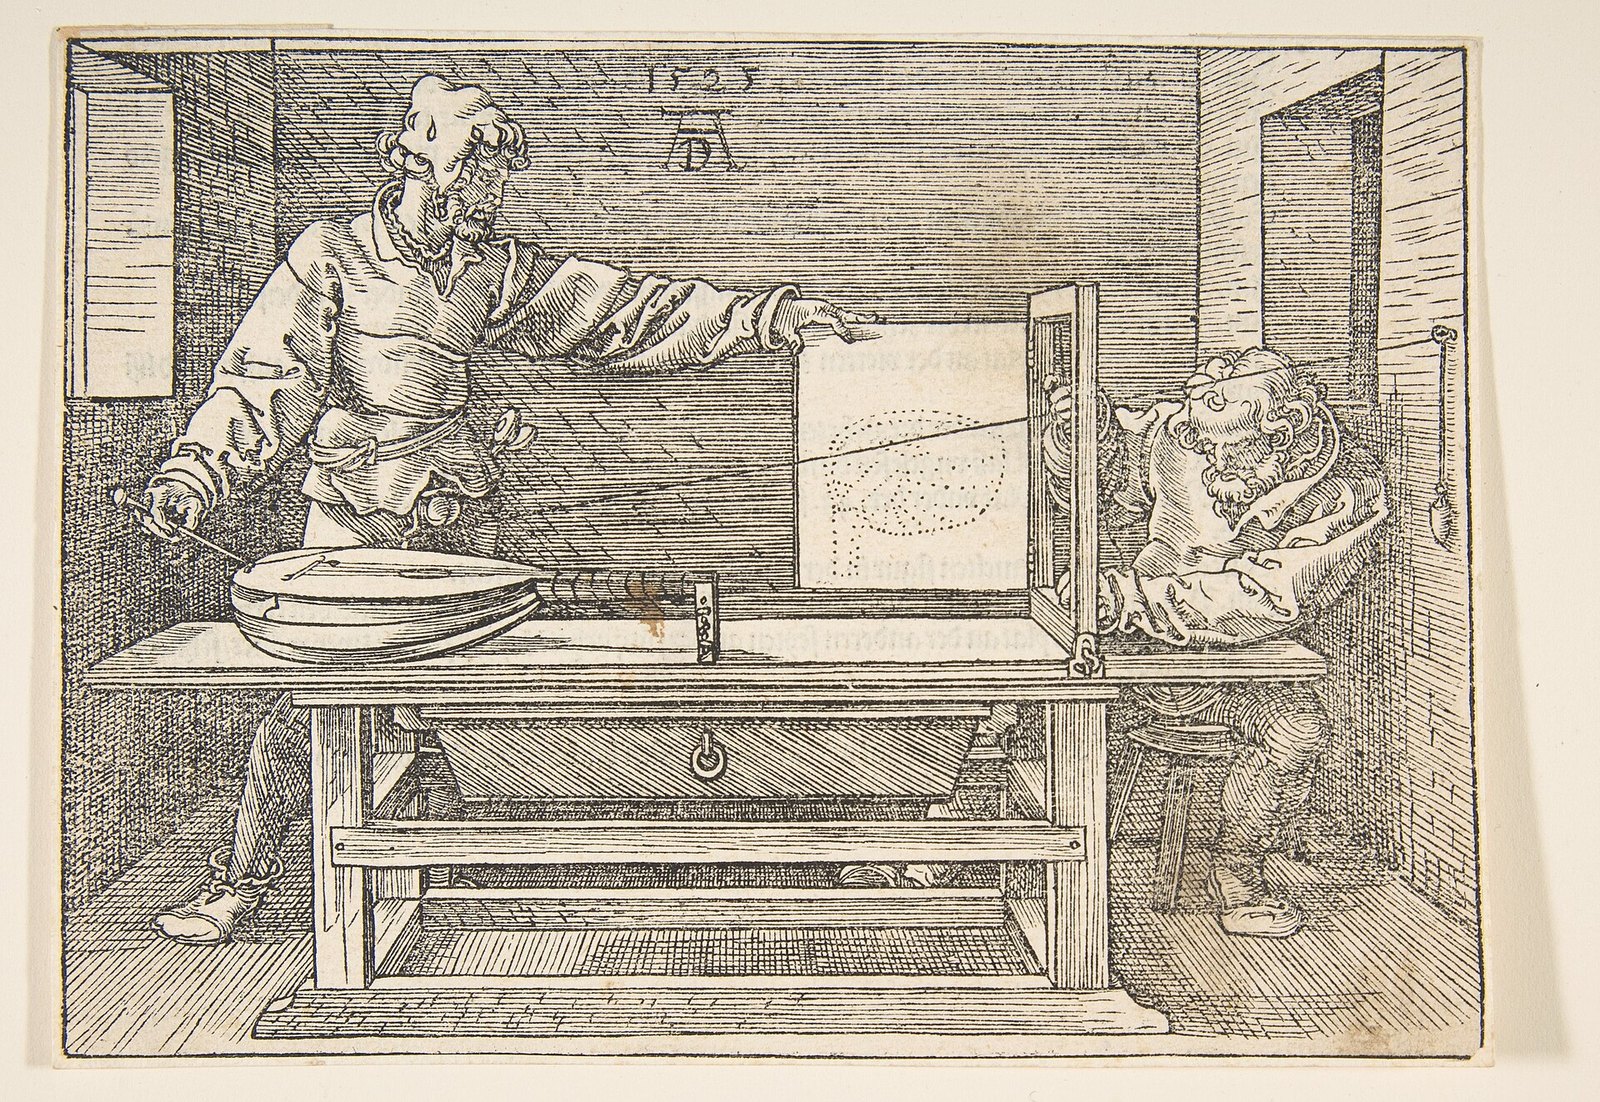
In 1971 the economist and psychologist Herbert Simon pointed out something that sounds obvious now and was easy to miss then. Information consumes the attention of the people who receive it. So, as he put it, a wealth of information creates a poverty of attention. Simon was writing about organisations drowning in reports and memos, years before the web existed, but he described the central fact of the internet with uncomfortable accuracy. Information is cheap and endless. Attention is limited, and it is the thing everyone is competing for.
Much of the modern web is designed accordingly. Video starts playing before you ask for it. Feeds have no bottom. Notifications arrive with red badges designed to be hard to ignore. A pop-up asks for your email address before you have read a single line of the article you came for. These designs are very good at producing clicks, sign-ups and time on site, which are the numbers many companies are paid by. They are much less good at respecting the person on the other side of the screen, who usually came to read something, learn something or get something done, and leaves feeling slightly worse.
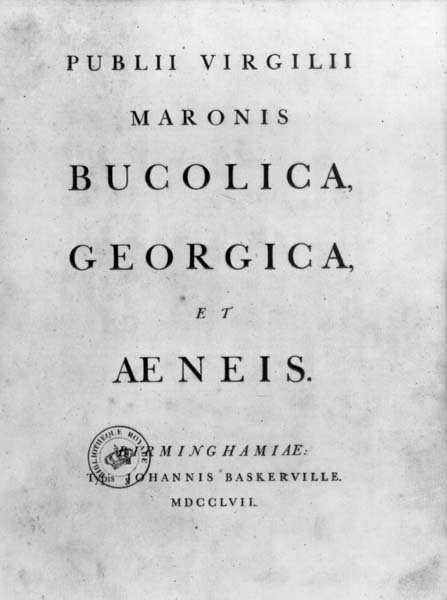
When I built this site, I tried to design for attention in the other sense of the phrase: to make it easy to pay attention, and then to get out of the way. That is not a new ambition. Printers and typographers have been working on it for five centuries, and their conclusions are surprisingly consistent. The words and images should be the loudest things on the page. Everything else, from navigation and buttons to borders and icons, should stay quiet until it is needed. That is the reason for the mostly black, white and grey palette here, the generous margins and the small number of decorative elements. Colour, when everything is grey, becomes a signal, and a signal used everywhere stops meaning anything.
Comfortable reading depends on a few things that are easy to measure. Long lines are tiring, because the eye has to travel far to the right and then find the start of the next line again, and it is easy to land on the wrong one. Typographers have long recommended somewhere around 45 to 75 characters per line for continuous text, and the body text here is set within that range. Type should be large enough to read on a phone held at a normal distance, without zooming. Contrast should be strong: dark text on a light background, or the reverse in dark mode, with no pale grey text for anything that matters. Spacing between lines needs to be generous enough that the lines do not blur together, but not so loose that the text falls apart into separate strips.
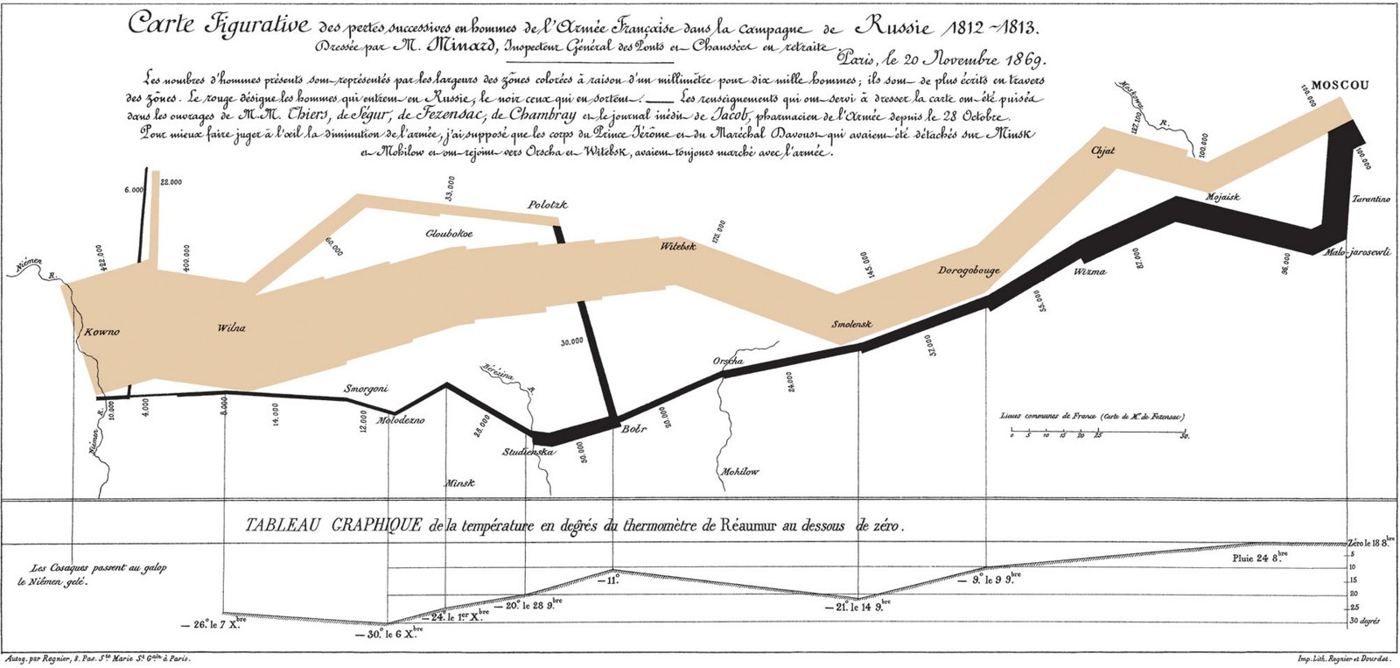
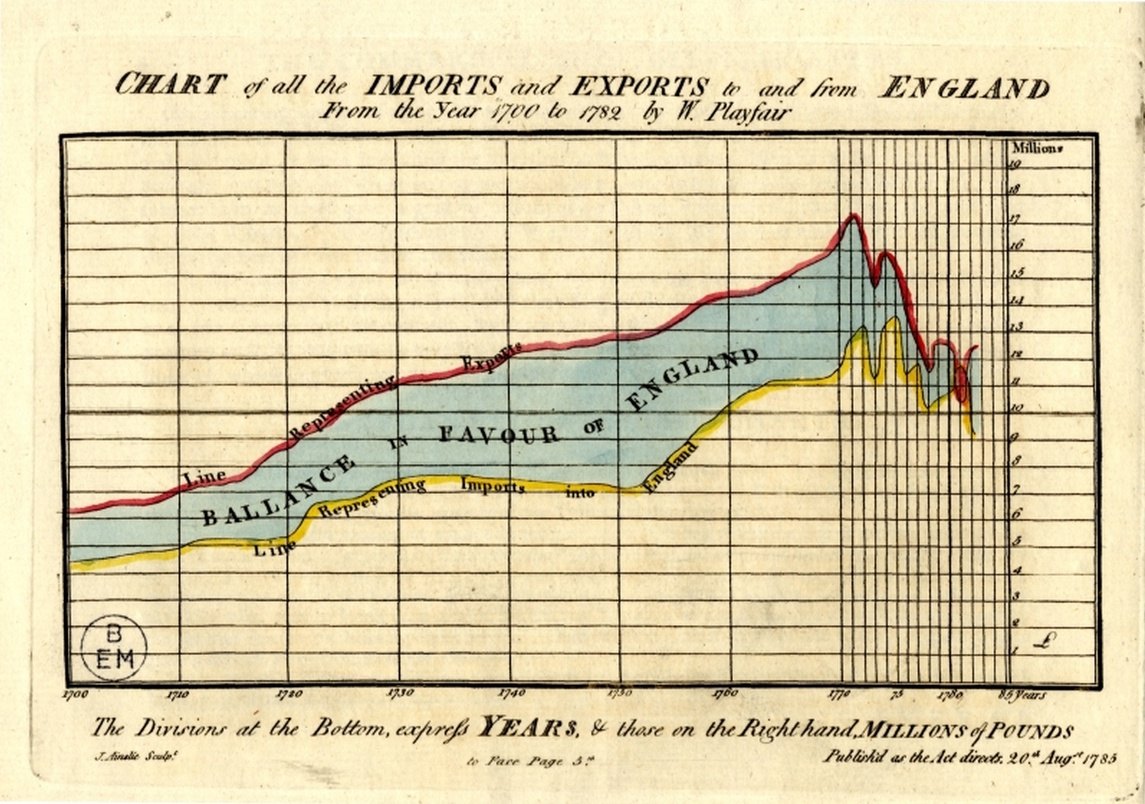
Good information design follows the same principle as good typography. In 1786 the Scottish engineer William Playfair published The Commercial and Political Atlas, which introduced the line graph and the bar chart to a public used to reading trade figures in long tables. His charts were simple, and that was the point: the shape of a nation’s imports and exports over a century could be seen at a glance. Almost a hundred years later, the French civil engineer Charles Joseph Minard drew his famous chart of Napoleon’s march on Moscow in 1812, in which the width of a single band shows the size of the army as it shrinks from over four hundred thousand men to about ten thousand, with the temperature during the retreat plotted underneath. It holds six kinds of information in one picture, and nothing in it is decoration.
Movement is the hardest thing to get right, because the eye cannot ignore it. We are built to notice motion at the edge of our vision, which is useful for spotting predators and very distracting when you are trying to read a paragraph. Animation can help when it means something: it can show that a menu has opened, where a new piece of content came from, or that an action has worked. But motion that has no meaning is a small tax on attention every time it happens. Here, elements fade in gently once as you scroll to them, and nothing moves while you are reading. People who have asked their operating system to reduce motion get no animation at all, because that setting is a direct statement of what they need.
The most serious failures of attention design are not accidents. The designer Harry Brignull coined the term “dark patterns” in 2010 for interfaces deliberately built to trick people into doing things they did not mean to do: subscriptions that are easy to start and almost impossible to cancel, countdown timers that reset when the page is reloaded, buttons designed to be pressed by mistake, and checkboxes that opt you in to marketing unless you notice them. These designs often work in the short term. They cost trust in the long term, and once a reader suspects a site of manipulating them, they read everything on it differently. A personal site has no reason to use any of them, and this one does not.
Respecting attention also means respecting time. Each article here shows roughly how long it takes to read, so you can decide whether you have the time now. Search is one click away from every page. Every entry links to related pieces at the end, so you can go deeper if a subject interests you, or close the tab satisfied if it does not. There are no infinite feeds and no suggestions designed to keep you scrolling after you have found what you came for.
The test I keep coming back to is simple. If a reader finished a page and closed the tab, would they feel the time had been well spent? A page that passes that test has done its job, even if nobody clicked on anything. Many products are measured by how much attention they capture. I would rather measure this site by how well it uses the attention it is given.
Ayoub Khallok keeps this archive of essays, research, lessons and notes, written to understand things more clearly. More about Ayoub.
Enjoyed this piece? Follow along.
New essays, studies, lessons and notes arrive here a few times a month. There's no newsletter or algorithm, just an RSS feed for every section, so you can follow only what interests you.
SubscribeSubjectsDesign, Technology
Filed inWriting